TryHackMe - Directory DFIR lab
Daan Perry - 2025-07-20
Directory DFIR lab walkthrough
Find the lab here https://tryhackme.com/room/directorydfirroom
Let me start of with saying, no answers will be shared in this post. This post will only describe my process and how I found the answers for this lab. This post is meant for those who either got stuck or are curious about how other people solved this lab. I encourage you to try this lab on your own first and only use a walkthrough when you have been stuck for an hour. I will be sharing the mistakes I made, and how I got out of being stuck in hopes that it may help others learn too.
General advice
Research, research & research. Do not use a single search engine, try multiple. If you are using LLMs be sure to use multiple, the hallucinate so double check. Make notes, found something that looks relevant? Write it down, keep track of where you found it and in what context. I personally like Joplin, but use whatever works for you. Information that may not be of use right now could become relevant later.
The scenario
A small music company was recently hit by a threat actor.
The company's Art Directory, Larry, claims to have discovered a random note on his Desktop.
Given that they are just starting, they did not have time to properly set up the appropriate tools for capturing artifacts. Their IT contact only set up Wireshark, which captured the events in question.
You are tasked with finding out how this attack unfolded and what the threat actor executed on the system.
Walkthrough
I completed this lab om a Kali Linux machine, the lab description recommends not using the AttackBox on THM. The reason for this is that we are going to need a couple of scripts and python packages. The free version of THM does not allow the AttackBox to access the internet, this complicates getting access to these extra tools.
The first thing we need to do is download the .pcap file and choose our tools. My tool of choice for this Digital Forensics and Incident Response (DFIR) lab, is to start out with WireShark to get an idea of what we are dealing with.
Right after opening the .pcap file in WireShark we can see that the file starts with a port scan. It is obvious that the IP
10.0.2.74
is our attacker and 10.0.2.75
our host. We can see the [RST, ACK] packets indicating that those ports are closed.Not seeing a src.port or dst.port column?
Here is how to add new columns to your WireShark UI
- - Right click the table header
- - Select "Column preferences"
- - Add two new columns by clicking the plus icon
- - Give one column a name like "Source Port" or "src.port" and select the type "Source Port"
- - Give one column a name like "Destination Port" or "dst.port" and select the type "Dest port (resolved)
- - Finally drag each column below their IP column and click "Apply"
First view of the pcap file
Finding open ports
Question 1:
What ports did the threat actor initially find open? Format: from lowest to highest, separated by a comma.
What ports did the threat actor initially find open? Format: from lowest to highest, separated by a comma.
To answer this question we can start with a simple initial filter. We know our attackers IP and our host IP. What we can also deduce from the first 30 packages is that our host will report with [RST, ACK] if a port is closed and [SYN, ACK] if a port is open.
Combining these into one filter:
ip.dst == 10.0.0.2.75 and tcp.flags.reset == 0 and tcp.flags.ack == 1
Using these filters we can now also clearly see where the scan ended, so to make our lives easier we can filter the packets with on frame number to and sort the ports in descending order. The full filter command is:
ip.dst == 10.0.0.2.75 and tcp.flags.reset == 0 and tcp.flags.ack == 1 and frame.number < 1346
Open ports found
Valid usernames
Question 2:
The threat actor found four valid usernames, but only one username allowed the attacker to achieve a foothold on the server. What was the username? Format: Domain.TLD\username
The threat actor found four valid usernames, but only one username allowed the attacker to achieve a foothold on the server. What was the username? Format: Domain.TLD\username
Before we start tackling this question directly it is wise to get a general idea of what information this PCAP file contains. We know that we're looking for 4 valid usernames, once of which was usable to the attacker. This also gives us the clue that we're likely looking for authentication attempts.
We'll start by going through the Statistics menu in Wireshark. Here there are multiple clues as to where we should focus our attention next. The Protocol Hierarchy windows shows information about the protocols present in the PCAP file. Two things stand out, Kerberos - a Network Authentication Protocol and many requests with the content type of "MIME Multipart Media Encapsulation".
Let's start with Kerberos since it is an authentication protocol. To show all Kerberos related packets use the
kerberos
filter.Kerberos is not something I am very familiar with. Before I started to dig into the logs I decided to read up on some basic Kerberos concepts. Robert Broeckelmann had some excellent articles which cover some of the basics and concepts to focus on. What stands out immediately in the PCAP file is that there are multiple [AS-REQ] requests, but only two [AS-REP] requests.
Terms explained
AS-REQ - Authentication Service - Request
AS-REP - Authentication Service - Response
TGT - Ticket Granting Ticket
AS-REQ - Authentication Service - Request
AS-REP - Authentication Service - Response
TGT - Ticket Granting Ticket
Kerberos packets found
That is promising, we know now that the [AS-REP] is returned only when a user successfully authenticates. This is further confirmed by both [AS-REP] packages having the same username and domain. In our case there is no need to inspect all the other [AS-REQ] packages, however if the lab also required us to find the other 3 usernames this is where we would look.
Another question answered, we now know which user account on which domain was compromised and how.
Captured Hash
The threat actor captured a hash from the user in question 2. What are the last 30 characters of that hash?
There are two [AS-REP] packets, even without understanding Kerberos indepth we can deduce that one of these likely contains the hash we are looking for. Both AS-REP packets contain two ciphers, the first one both of type 18 and the second one has a type 18 and a type 23. More research led to learning that the cipher of type 23 is encrypted with the users password and is also easier to crack with Hashcat. Copy the last 30 characters of this hash to answer the 3rd question.
User's password
What is the user's password?
As mentioned before, we know that the cipher of type 23 is encrypted with the users password. The next logical step would be to crack this hash. Much of the information online assumes we have access to the machine running Kerberos to grab a key in the correct format. However in this lab we only have access to the pcap file. Therefore the information we have collected so far will have to do. The first step is to see which format Hashcat expects, Hashcat also provides example hashes which we can use to construct our own hash.
https://hashcat.net/wiki/doku.php?id=example_hashes
https://hashcat.net/wiki/doku.php?id=example_hashes
Important to remember is that our hash is retrieved from the [AS-REP] packet. We're therefore using the
If we plug all the information we have into this format and run Hashcat we get... an error
-m 18200
option for format $krb5asrep$23$user@domain.com:hash
If we plug all the information we have into this format and run Hashcat we get... an error
"Separator unmatched"
Problem solving
My first real problem. I was missing something, many of the sources I had checked online mentioned a salt. I probably spent a good hour searching online and asking LLMs, who kept saying my hash was formatted correct so it must be the wrong hash. (Wrong) My instincts were right, after learning that Hashcat required another $ and that the salt was likely to be 32 characters / 16 bytes I tried simply placing another $ inside the hash after 32 characters. Bingo, Keep It Simple Stupid rang true once again.
My first real problem. I was missing something, many of the sources I had checked online mentioned a salt. I probably spent a good hour searching online and asking LLMs, who kept saying my hash was formatted correct so it must be the wrong hash. (Wrong) My instincts were right, after learning that Hashcat required another $ and that the salt was likely to be 32 characters / 16 bytes I tried simply placing another $ inside the hash after 32 characters. Bingo, Keep It Simple Stupid rang true once again.
In summary, simply adding another $ 32 characters into the hash create a valid hash that can be cracked with Hashcat.
2nd and 3rd command executed
What were the second and third commands that the threat actor executed on the system? Format: command1,command2
Since we found the packet where the attacker successfully authenticated this is were I continued my investigation. Interesting is that the attacker briefly tried SMB2 but quickly gave up. Important to note is I used the
ip.addr == 10.0.2.74
as a filter to focus on the relevant packets.
The next section is not required to complete this lab
However I did learn something new here so I have left it in this walkthrough.
However I did learn something new here so I have left it in this walkthrough.
The next thing that stands out is the number of POST requests going to
/wsman
some of which include NTLMSSP_NEGOTIATE, NTLMSPP_CHALLENGE and most importantly NTMLSSP_AUTH followed by a 200 response. During earlier research on the Kerberos protocol I read a Medium post by Clement Notin which explicitly mentions the Kerberos protocol, NTML/NTMLSSP and using the password in Wireshark.Since the blog post mentions creating Keytab files I went this route first. However in my case this did not lead to anything useful. At this point I realized that the pace of this lab was so well thought out that the previous question was always a hint for the next. The next step was to add the password we found to the NTLMSSP protocol in Wireshark.
This can be done by adding the password to the NT Password field in Edit -> Preferences -> Protocols -> NTMLSSP
This can be done by adding the password to the NT Password field in Edit -> Preferences -> Protocols -> NTMLSSP
Now if we recheck the NTMLSSP_AUTH packet again we can see that Wireshark can decrypt the data. This gives access to fields like User name, Host name and more importantly a Session key. At this point I thought I hit the jackpot, but it turned out that this session key would not be of any use later on.
Adding a password to Wireshark
Back on track
What else can we get from the /wsman POSTS requests. If we investigate the stream (Right click a packet -> follow
-> TCP Stream) we can deduce that the attacker used the Python PSRP Client program to authenticate with some service and started sending soap+xml data. This makes it likely that the commands we are looking for are hidden in the encrypted data in these packets.
-> TCP Stream) we can deduce that the attacker used the Python PSRP Client program to authenticate with some service and started sending soap+xml data. This makes it likely that the commands we are looking for are hidden in the encrypted data in these packets.
NTMLSSP_AUTH packet found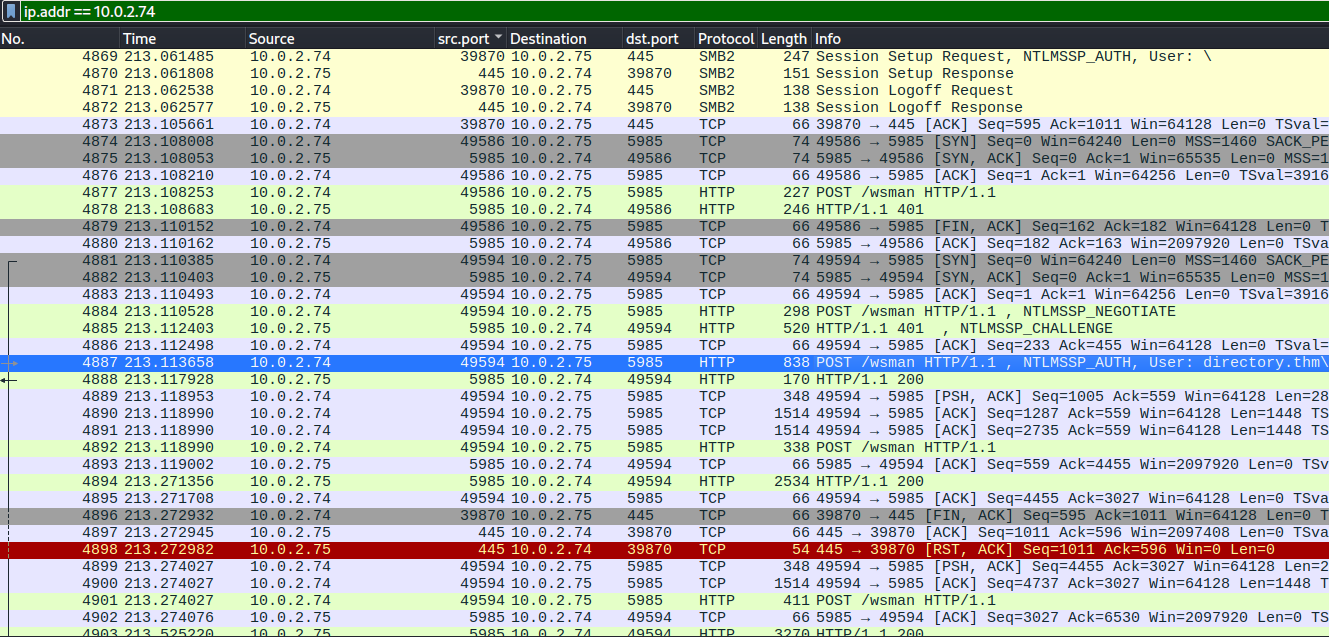
By reading up on WSMan we learn that WS-Management is used for the management of servers, devices and other applications.
"WS-Management (Web Services-Management) is a DMTF open standard defining a SOAP-based protocol for the management of servers, devices, applications and various Web services"
Running a google search for WSMan decryption returned results for a gist and a blog about decrypting WinRM.
Decrypting winrm traffic from ad hashes
winrm.decrypt.py decrypt WinRM
I initially dismissed this as WinRM sounded like a different protocol.
Big mistake! WinRM is simply another implementation of the WS-Management protocol.
Initially I wasn't too confident this script was going to work as the comments underneath the gist aren't too positive. I decided to give it a try anyway. The script takes in an entire pcap file, so it is best to create a new pcap file with only those packets related to the TCP stream we are investigating.
When following a stream Wireshark will automatically filter on these packets only. These can then easily be exported in Wireshark by going to
Next run the Python script:
on the new wsman_commands.pcap file, this will create a .xml file with all the commands Base64 encoded.
File -> Export Specified Packets
, we'll be exporting this as wsman_commands.pcap so we can refence it later.Next run the Python script:
./winrm_decrypt.py wsman_commands.pcap --password password_from_question_4
on the new wsman_commands.pcap file, this will create a .xml file with all the commands Base64 encoded.
The command found after decrypting the wsman_commands.pcap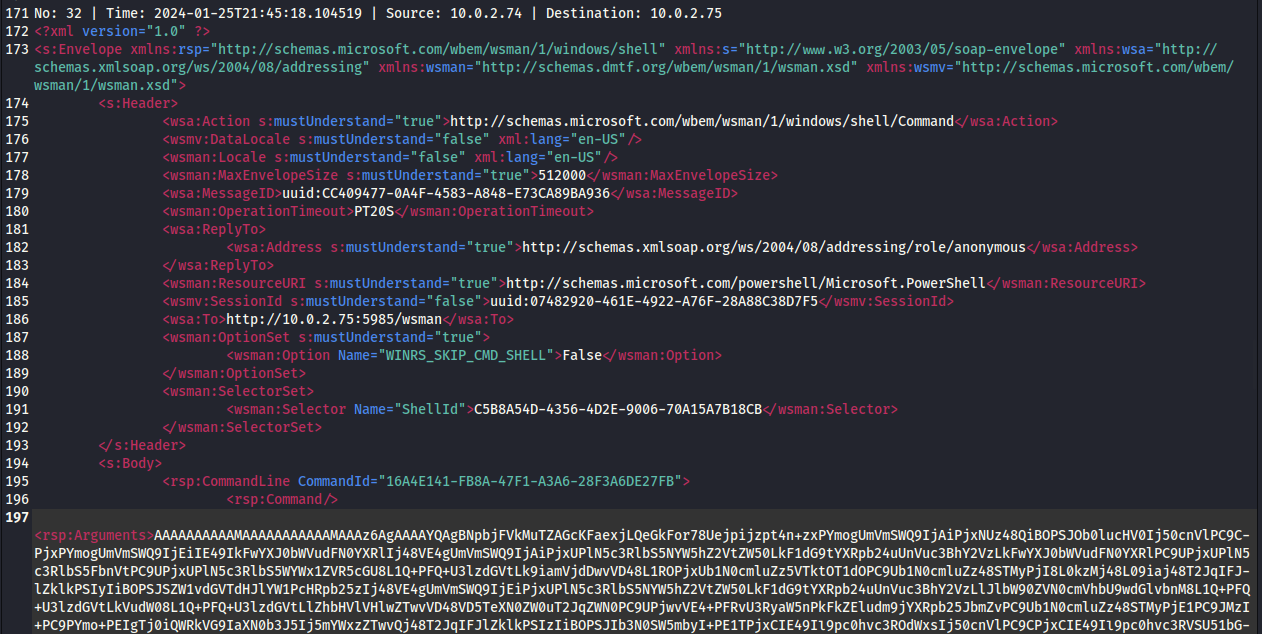
Another hiccup
The XML file only included a single Base64 encoded command. Decoding this in Cyberchef we find that the Command "hostname" was send, but nothing else.
Returning to Wireshark and filtering on
The XML file only included a single Base64 encoded command. Decoding this in Cyberchef we find that the Command "hostname" was send, but nothing else.
Returning to Wireshark and filtering on
http.request.method == "POST"
packets we find that the user authenticated a second time, this time using a Ruby WinRM Client. Repeating the previous steps of Following the TCP Stream and creating a new PCAP file File -> Export Specified Packets
we now get a bigger file that includes all the commands send through this Ruby client. 36 commands to be exact.The second NTLMSSP_AUTH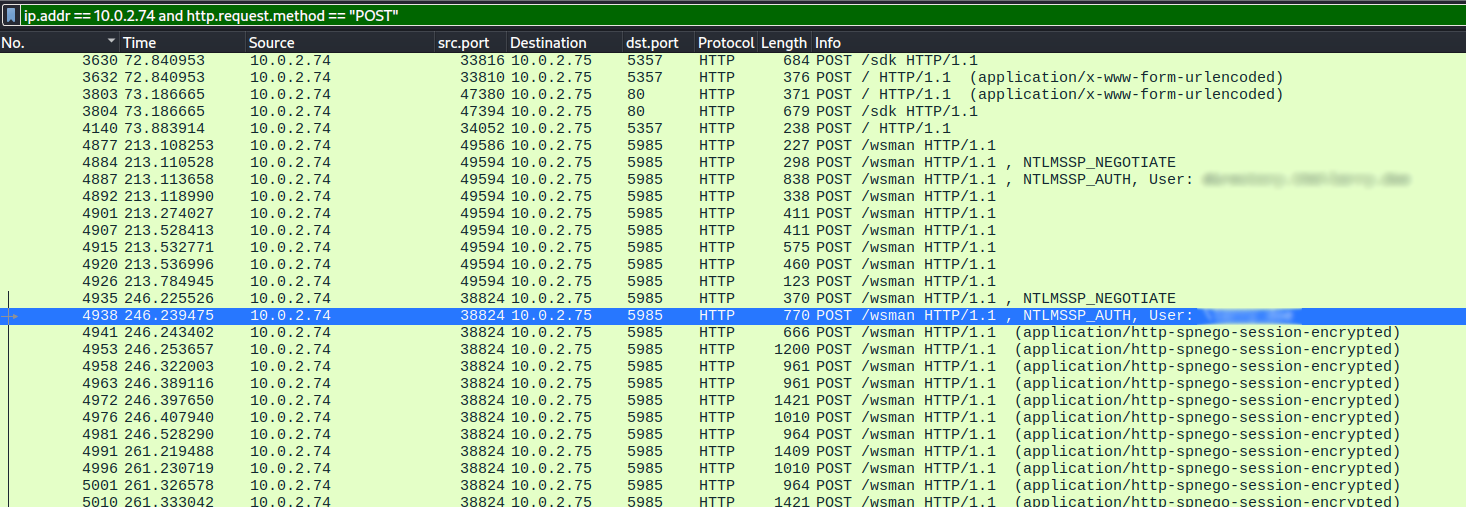
At this point the file is too big for Mousepad to handle. Since we already figured out that the commands can be found by searching for
Now all we have to do is go through the extracted commands and figure out what is going on.
<rsp:Arguments>
we can create a python script to extract all the Base64 commands.Now all we have to do is go through the extracted commands and figure out what is going on.
Quick note on counting commands
An observation that I do not have an answer too, is that the command "(get-location).path" show up every so often. It is either send automatically or the room creator did not count this command as a "Command executed by the threat actor" and therefore does not count as a first or second command. Also the command send initially through the Python session was not considered the "first" command.
An observation that I do not have an answer too, is that the command "(get-location).path" show up every so often. It is either send automatically or the room creator did not count this command as a "Command executed by the threat actor" and therefore does not count as a first or second command. Also the command send initially through the Python session was not considered the "first" command.
Commands extracted by our Python script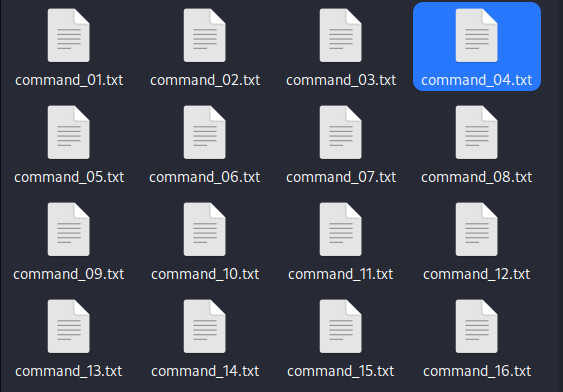
Flag
What is the flag?
The last task to complete is finding the flag. All commands are already exported for the previous question. My gut feeling tells me the flag is likely present in one of the last commands send. Starting from the bottom we can quickly find the flag in the same files.
Conclusion
A very fun lab, compliments to the creator for pacing this lab the way they did. A good portion of the time was spend on learning about Kerberos, Kerberoasting, NTLMSSP & WS-Management. I hope that this walkthrough helped you out and that it gave you an idea of how to solve similar challenges in the future.